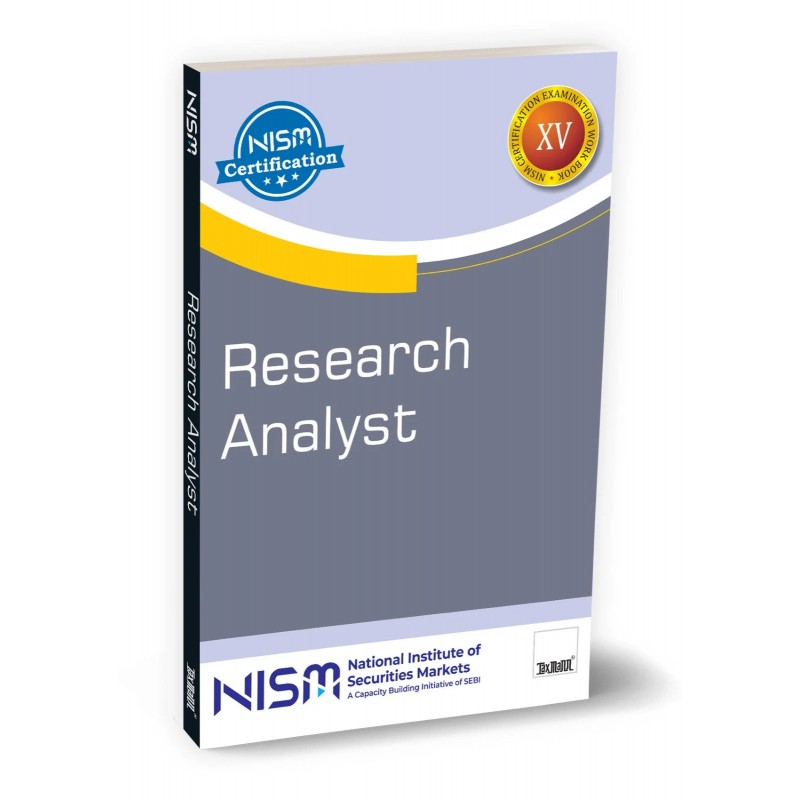
Research Analyst by National Institute of Securities Markets Edition August 2026
Description
Research Analyst is a complete working manual on how investment research is actually done in India—written by practitioners, published by the National Institute of Securities Markets, and built around real companies, real filings and real charts rather than textbook abstractions. Its 15 chapters trace the full arc of the job: what an analyst owes the market, the vocabulary of equity, debt and commodity instruments, and then the analytical funnel that structures all fundamental research—economy → industry → company → valuation → recommendation — before closing with the conduct rules governing published research, technical analysis, and case studies from market history.
What distinguishes it is that it teaches from real documents. The financial-analysis chapter is built around the actual consolidated annual report of Bharti Airtel for FY2018-19—balance sheet, profit and loss, cash flow statement and even the note on borrowings reproduced as exhibits, with every ratio then computed on Airtel’s own numbers: an EBITDA margin of 32.2%, ROE of 2.1%, debt-to-equity of 1.52x and negative working capital of ₹601.49 billion. Kingfisher Airlines stands beside it as the counter-case—five straight years of negative profit before tax and negative operating cash flow, a company borrowing to pay its interest. Elsewhere, the book prices a bond with a live Excel screenshot, reproduces a genuine Sovereign Gold Bond order book to show what illiquidity looks like on screen, and works its technical chapter from real price charts of the Nifty and of Reliance, Infosys and five other Indian stocks.
It is also candid, and amended. This is not a book that hedges: it tells you a current ratio below 1 is not automatically a red flag, that a price-to-book below 1 does not make a stock a bargain, and that complicated quantitative models need not mean the valuation is precise; it only means a false impression of preciseness. Buffett, Munger, Graham and Klarman are quoted where they sharpen an argument rather than decorate it. And the regulatory material is footnoted to SEBI circulars running to February 2026, covering what has genuinely changed in the profession—including two distinct clauses on the use of Artificial Intelligence in research work.
The Present Publication is the March 2026 Workbook Version developed jointly by the Certification Team of NISM and subject matter experts, Mr Manish Bansal, Mr Ramesh Varakhedkar, Mr Vijay Kanchan and reviewed by Prof. Kameshwar Rao and Mr Prakash Gaba. It is published exclusively by Taxmann, with the following noteworthy features:
- [A Complete Real Annual Report, Worked End to End] Bharti Airtel’s FY2018-19 consolidated statements across nine exhibits, used as the computation base for every ratio taught
- [Real Indian Corporate Actions with Dates and Ratios] The SBI stock split from ₹10 to ₹1 face value (₹2,700 to about ₹295), and Adani Enterprises’ April 2018 demerger of Adani Green Energy at a 761:1000 entitlement ratio
- [Named Indian Company Examples Throughout] PVR on the difficulty of defining an industry, Micromax on competitive entry, Cera Sanitaryware and Navneet Publications on the BCG matrix, Reliance on pricing power, Jet Airways on consolidation, Suzlon as a forecasting cautionary tale, ITC and L&T on sum-of-the-parts
- [Four Strategic Frameworks Taught with Diagrams] Porter’s Five Forces, PESTLE, the BCG Matrix and SCP analysis—alongside the GICS 2023 classification structure from MSCI
- [A Ready-to-use 40-Item Research Checklist with Hard Screens Built In] Net profit margin above 10%, debt-to-equity below 1, interest coverage above 3, ROE and ROCE both above 15%, each sustained over five years
- [Published Rating Conventions with Numeric Thresholds] A ‘buy’ implying more than 10% expected return over twelve months, ‘hold’ between −10% and +10%, ‘sell’ below −10%
- [Twenty-Nine Illustrations in the Technical Chapter] Ten of them real price charts of Indian indices and stocks
- [Worked Numbers, Not Just Formulae] A hedge-ratio computation on MCX copper, PEG and price-to-book comparisons across paired companies, an EV-to-capital-employed exercise reverse-solved for a required return, adjusted-price arithmetic for bonuses, splits and consolidations, and CAGR and XIRR shown as spreadsheet screenshots
- [Seventy Questions and Sub-Questions, with Answers] Including four extended case-lets with linked sub-questions covering peer comparison, forecasting, comparable-company valuation and chart reading
- [Case Studies from Market History] The Barings collapse and the 2008 credit event told at length, with shorter profiles of Enron, WorldCom, Satyam, Madoff, Milken and Rajaratnam
The coverage of the book is as follows:
- Introduction to Research Analyst Profession
- Introduction to Securities Market
- Terminology in Equity and Debt Markets
- Fundamentals of Research
- Economic Analysis
- Industry Analysis
- Company Analysis – Business and Governance
- Company Analysis – Financial Analysis
- Corporate Actions
- Valuation Principles
- Fundamental Analysis of Commodities
- Fundamentals of Risk and Return
- Qualities of a Good Research Report
- Legal and Regulatory Environment
- Technical Analysis
- Annexures
The book follows a progressive, analyst-centric structure:
- Every Chapter Uses the Same Template — It opens with a boxed Learning Objectives panel and closes with a shaded Sample Questions box in which the correct answer is printed in bold within the options—self-check without flipping to a key at the back
- The Sequence Follows the Order Research Actually Gets Done — Profession and market context, then research philosophy, then the top-down funnel of economy, industry and company, then corporate events and valuation, then commodities and risk, then the written output and the rules that govern it, and finally technical analysis as a complementary discipline
- Exhibits Appear Where They Earn Their Place — The financial-analysis chapter is entirely tabular—nine exhibits and no charts. The industry chapter is the visually supported frameworks chapter. The company-governance chapter is unbroken checklist-driven prose with no figures at all. The technical chapter carries 29 illustrations
- Depth Escalates with Importance — Early chapters close with one to three short questions; the chapters on financial analysis, valuation and technical analysis carry extended case-lets with four and six linked sub-questions built on full financial summaries and real charts
- Footnotes Point Outward — Thirty-two numbered footnotes run through the book, and those in the later chapters carry full SEBI circular URLs with dates—so a reader can go straight to the source rather than take the summary on trust
About the Author
National Institute of Securities Markets : The National Institute of Securities Markets (NISM) is an educational institution established in 2006 by the Securities and Exchange Board of India (SEBI), the regulator of India’s securities markets. Its creation followed the Union Finance Minister’s 2005–06 Budget announcement, which called for an institution dedicated to teaching, training, and conducting research in the securities markets. Guided by its vision to ‘lead, catalyse, and deliver educational initiatives that enhance the quality of securities markets,’ NISM offers a spectrum of capacity-building programs, ranging from basic financial literacy workshops to full-time postgraduate courses. Six Schools of Excellence drive its mission: the School for Certification of Intermediaries, the School for Securities Education, the School for Investor Education and Financial Literacy, the School for Regulatory Studies and Supervision, the School for Corporate Governance, and the School for Securities Information and Research. These Schools collaborate to professionalise the securities markets further.